Name That Raga An Analysis and Classification of Indian Classical Music
Background
Indian Classical music contains two primary divisions - North Indian Classical (Hindustani), and South Indian Classical (Carnatic). While both styles have their fundamental differences, the underlying structure of styles can be captured in a raga. A raga is defined as “a pattern of notes having characteristic intervals, rhythms, and embellishments, used as a basis for improvisation.” A raga can be compared to a type of scale in Western classical music. Though Western classical music does not have a direct equivalent to this concept, a raga is somewhat comparable to certain scales, such as a natural harmonic minor or a major scale. Every song has a raga that it is set to. For example, the Hindustani raga “Kafi” and the Western classical “Dorian” scale have the same note structure: C, D, D#, F, G, A, A# .
Our goal with this project is to show the quantifiable differences between ragas and to use those differences to build a raga identification tool. This tool would be able to “listen” to an audio clip and be able to classifiy the raga that the song is set to. It would mimic what seasoned listeners of Indian classical music do already: try to identify a raga while listening to music.
We will be analyzing the 10 main ragas of Hindustani/Carnatic music:
- Asavari (Hindustani)/ Natabhairavi (Carnatic)
- Bilawal / Dheerashankarabharanam
- Bhairav / Mayamalavagowlai
- Bhairavi / Hanumatodi
- Kafi / Karaharapriya
- Kalyan / Kalyani
- Khamaj / Harikhamboji
- Marva / Gamanashama
- Poorvi / Kamarvardhani
- Todi / Shubhapantuvarali
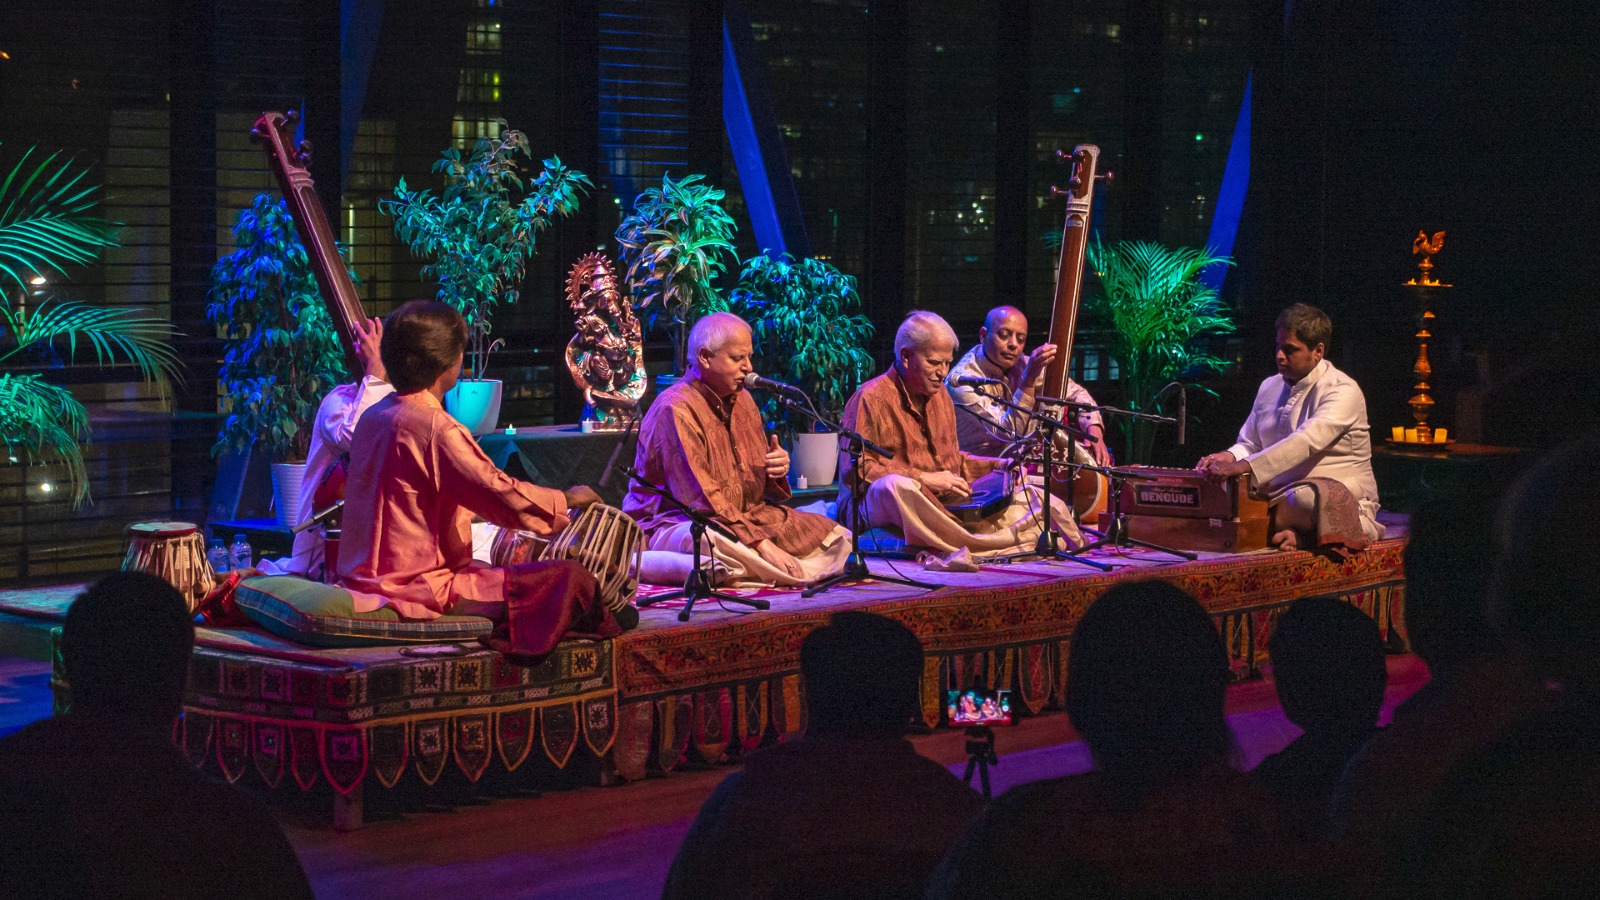
An Indian classical concert.
Data Cleaning
Once we narrowed down which ragas we would include in our analysis, we picked songs that are set to those ragas. Since these songs came from our personal collection, which includes mostly violin and vocal music, we used almost every song that we had that was set to the appropriate raga.
In Indian classical music, each artist plays in a specific sruthi, which is a pitch that the first note in the scale of the raga (sa) is played from. To make sure we could correctly analyze the difference between multiple songs, we identified what pitch each song was in and shifted the pitch of every song to be in C. We also chunked each of our songs to be 45 seconds in length so that later in our analysis, we could more accurately extract notes from them. We then loaded this information (encoded as an audio time-series array) into a csv for further use.
Feature Extraction & Analysis
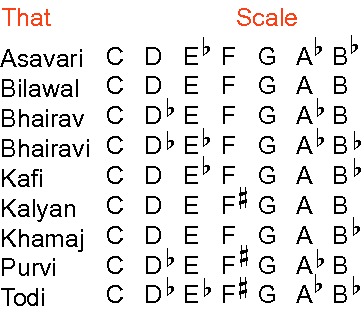
The 10 different ragas we are analyzing and their scales in the corresponding Western Classical notes
Our analysis attempts to show the quantitative differences between each of the 10 ragas with starting ideas on how we may go on to use these differences when building a classifier. We aim to do this in two parts: the first will focus on the frequency of notes in each raga and will discuss whether these note frequencies are expected given the raga or whether it is not.
The second part of our analysis will look at a sequence of notes taken from the clearest clip from each raga and will look at the most frequently occurring bigrams and trigrams. We will then compare these bigram and trigram frequencies with phrases that we know to be common in each raga and assess the accuracy of this quantification method.
Note Extraction
Our note frequencies for each raga were derived from the Python package librosa’s chromagram method. The chromagram method uses a Short-time Fourier Transform to identify the notes being played from the audio stream.
Given an audio time-series array, this method will assess how the pitch content of the time series is distributed over the twelve chroma bands, or pitches. After normalizing the pitches so all of the audio clips started in C, we extracted the sequence of notes from the chromagram. Librosa’s chromagrams, however, calculate 43 notes for every 1 second of audio provided. However when analyzing a sequence of notes, unlike when analyzing note frequency in general, it was really important that we minimized any notes that were played by accident or were incorrectly picked up by librosa (noise, quite literally). So, in order to minimize noise, we took the most-played note per second (the mode of every 43 notes). Looking at the arrays that generated the chromagram, we were able to isolate the loudest notes played in each second, based on its decibel value, and took the mode of that. Once we had a cohesive sequence of notes, we were able to determine the frequency with which each note of the C major scale was played or sung in any particular raga. This is important because when taking the top 7 most frequently played/sung notes, we were able to identify what the scale of a raga is with a good level of accuracy.
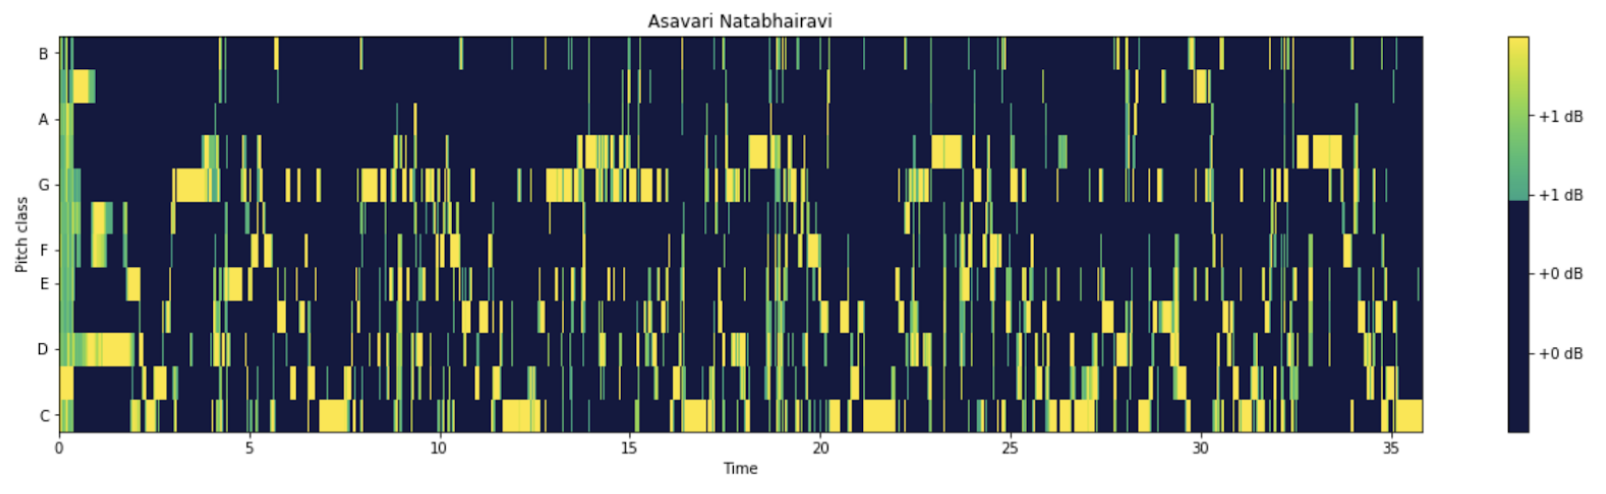
An example of a chromagram generated from an audio clip from raga Asavari
Part 1: Note Frequencies
Our note frequencies for each raga were derived from the Python package librosa’s chromagram method. In order to normalize our values and to make sure we accounted for artistic variation, we found the frequency of each note that was played for each clip. We then took the average of the frequency per note over all the clips and used that for our final note frequency value. In our visualizations, we display the top 7 most frequent notes. Ideally, these 7 notes would match exactly with the scale of every raga. We repeated this process for every raga.
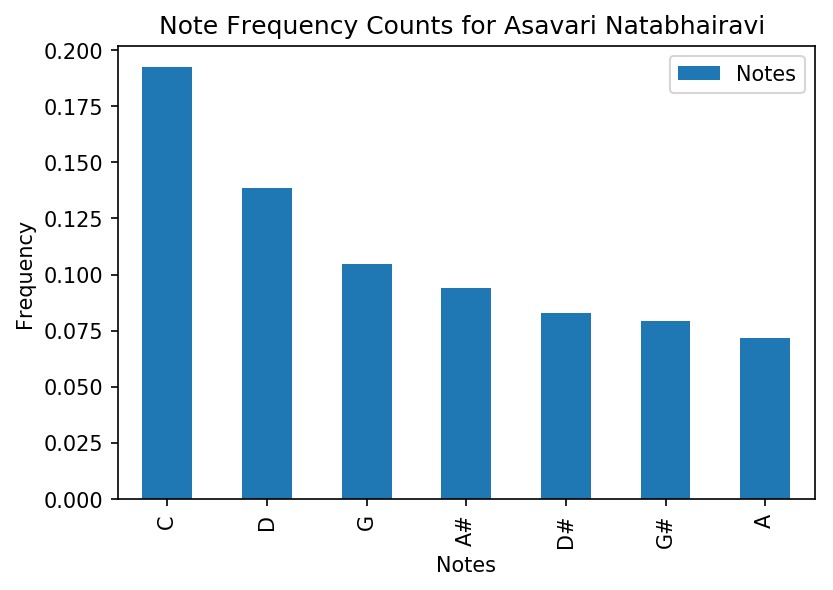
The frequency of occurance for the top 7 most occuring notes in Asavari
Part 2: Bigram/Trigram Analysis
After normalizing the pitches so all of the audio clips started in C, we extracted the sequence of notes from the chromagram, following the process we used to extract notes to calculate note frequencies.
Once we had our sequence of notes, we removed consecutive duplicates to prevent error while calculating n-grams. This was specifically to prevent n-gram calculation from including consecutive notes because this does not provide very much information about the patterns within the raga. For example, an artist holding the note sa (C) would result in many of the most frequent bi-grams being just a note that was consecutively held.
Calculating n-grams is useful in the scope of our project because it is very helpful in the quantification of ragas. Every raga has phrases (a sequence of notes) that form the identity of the raga. It is often after hearing one of these phrases that a listener is able to identify the raga of a song. Doing an n-gram analysis of a note sequence is a computational replication of the raga-identification method that advanced listeners use.
After removing these consecutive duplicates, we calculated the n-grams in our sequence of notes. Our analysis focuses mostly on the most common bigrams and trigrams found in each raga.
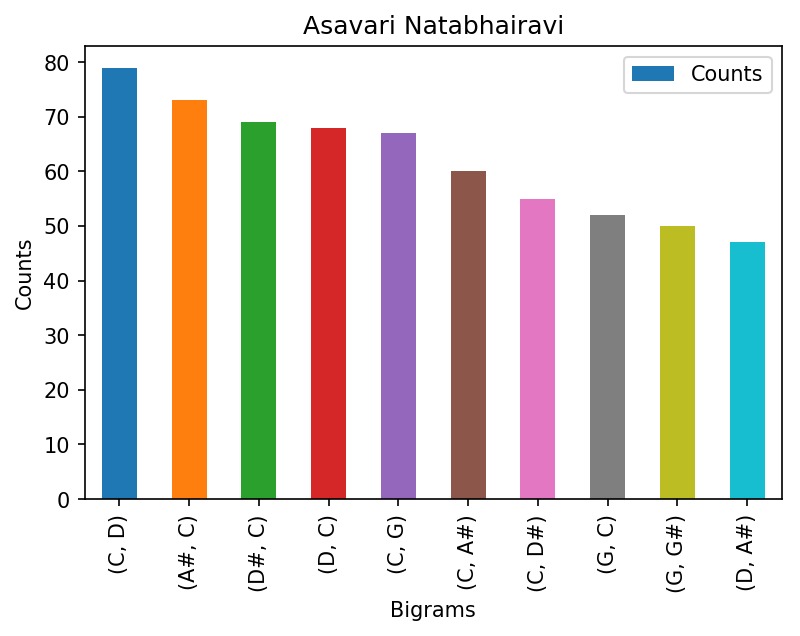
The most frequently occuring bigrams in Asavari
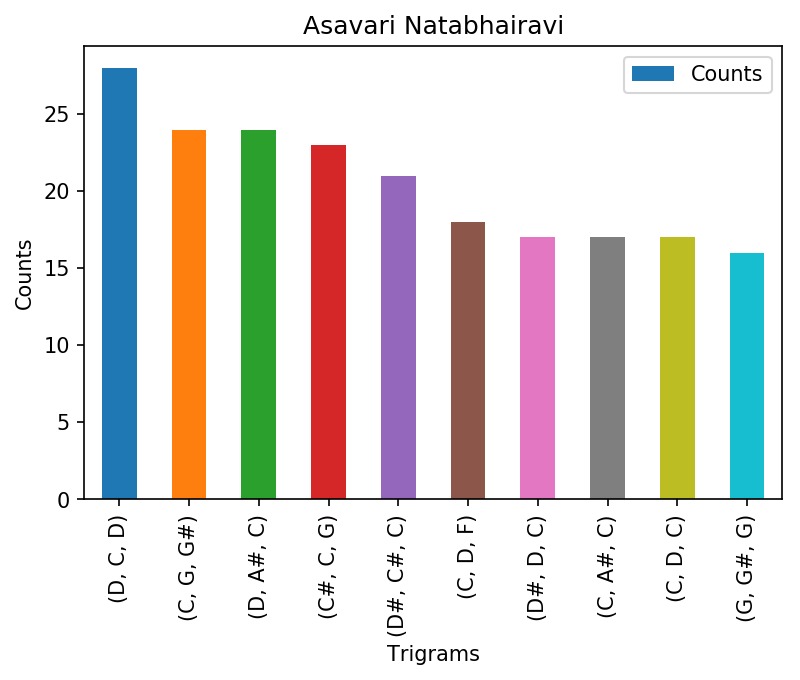
The most frequently occuring trigrams in Asavari
After extracting these features, specifically frequency of note occurrences, and bigrams/trigrams, we were able to start model training.
Model
Once these features were extracted we were able to process them into features that are usable within a model. This involved using a multi-label binarizer to one-hot encode the scales we had generated with the top 7 most frequently played/sung notes in each raga. We multiplied these one-hot encodings with the frequency with which each of these notes were played or sung. We then used these features to classify an “unseen” dataset with a Naive Bayes classifier. We trained our model on 19.5 minutes of training data and 10.5 minutes of testing data per raga.
Results
We believe our results are still in the early stages, but when developed further, could be extremely impactful and applicable to the broader Indian Classical music community. Our project tackles a problem that has existed in the community for quite some time. With a model that can retain its accuracy with a wider variety of ragas, we believe that it would be an extremely useful tool for every Indian classical music listener.
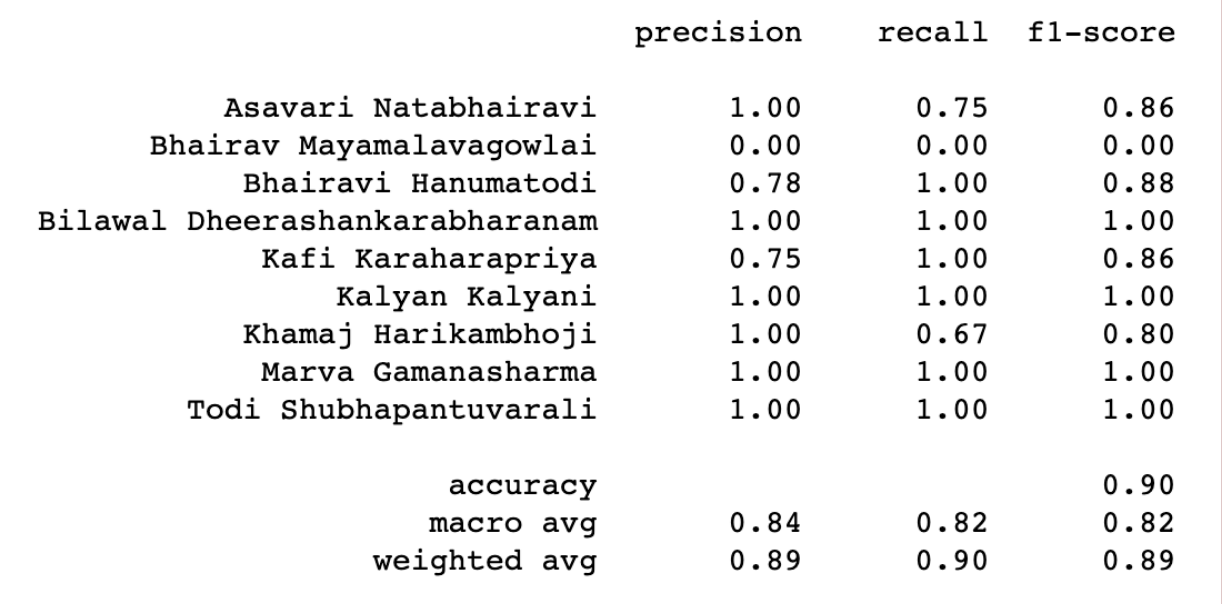
Classification accuracy for ten different ragas
After training several models using 70% of our cleaned audio data and testing with the remaining 30%, we decided to use the Naive Bayes classifier as our final model. With this classifier, we achieved 84.2% accuracy on the test set.
Future Work
While this project analyzed the top 10 ragas in Indian Classical Music, further work can be done to we extend our analysis to the 300+ existing ragas. We also hope to incorporate mood analysis and research with neural nets, so that we can rely on features beyond just note extraction and frequency. Mood analysis would be particularly useful in classification because two ragas can have the same exact scale, but differ in mood (or the way the notes are played), and therefore differ in classification.
Additional research would also include rhythm/tone/timbre analysis. There is currently a lot of work being done in the music research field in regards to rhythm and timbre specifically.